CNV Report Documentation#
Overview#
The CNV report provides a comprehensive overview of copy number variation (CNV) signals derived from CNVkit and (optionally) PureCN, together with quality metrics and visualization.
The report consists of:
Genome-wide CNV plots (from CNVkit)
Per-chromosome CNV and VAF plots
Segment-level table (CNVkit and PureCN)
Gene-region level table
Quality control metrics
Optional PON-based (Panel of Normals) interpretation
Input Data#
The report is generated from the following main inputs:
CNVkit bin-level data (
.cnr)CNVkit segment-level data (
.cns)CNVkit initial segments (
.cns)Germline VCF (for VAF visualization)
Cancer-associated genes list
Cytoband annotation
Panel of Normals (PON) (
.cnn) [Optional]PureCN LOH/segment output [Optional]
Purity/ploidy summary [Optional]
Chromosome Plots#
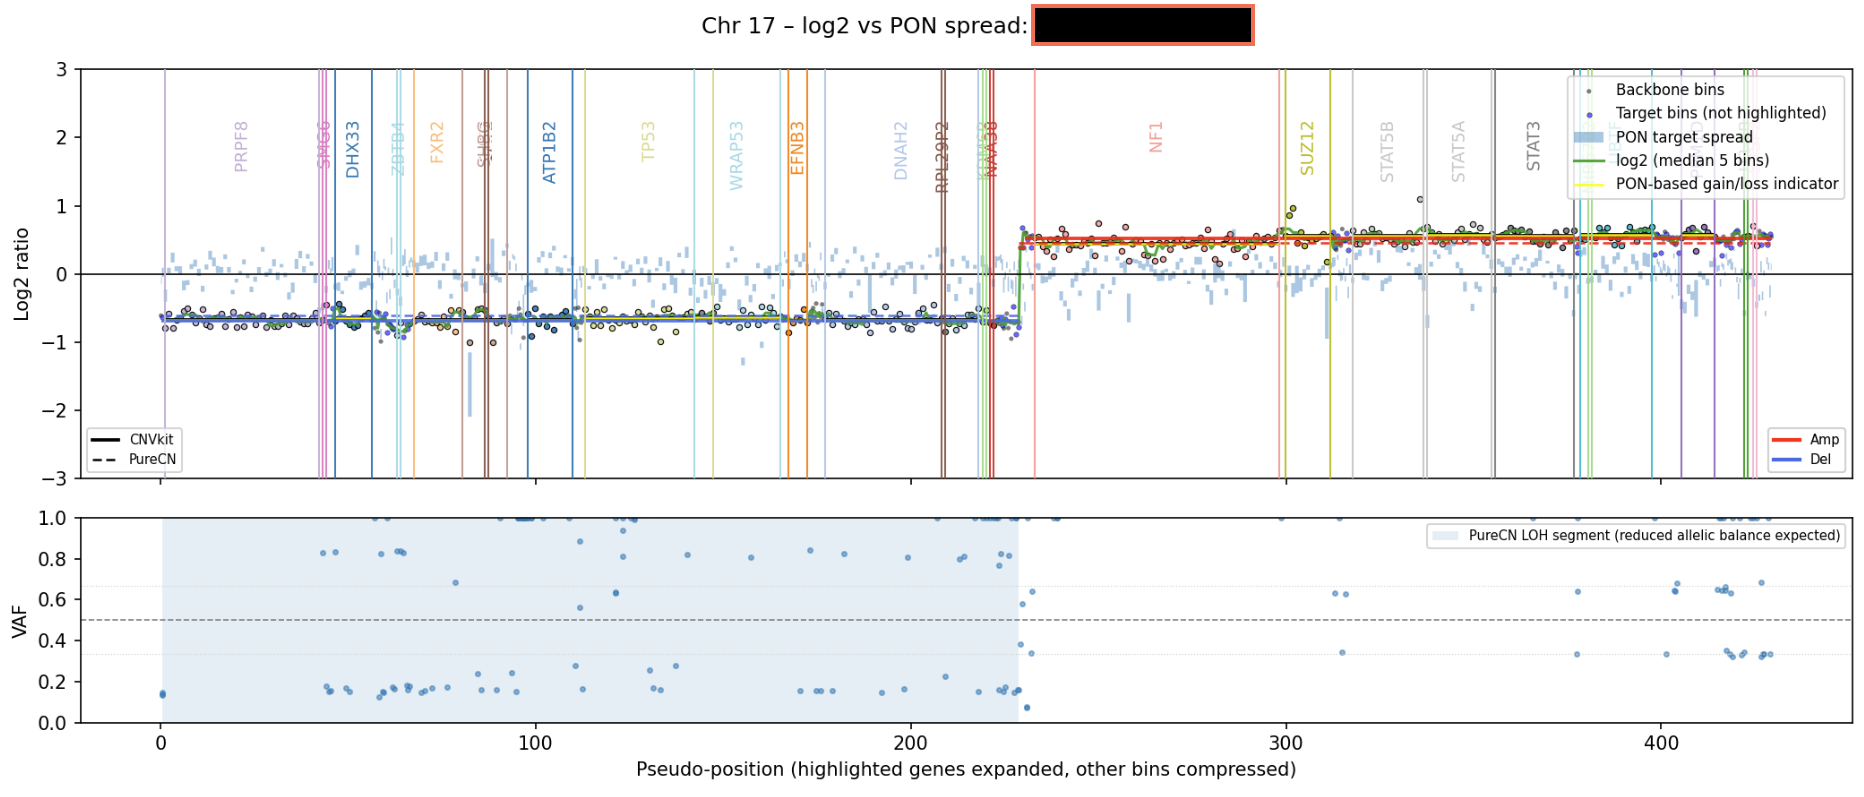
Each chromosome plot consists of two panels:
Top panel (CNV signal)#
This panel shows:
Individual bins (log2 ratios)
Smoothed log2 signal. Calculated using a sliding window median (5-bin window)
CNV segments: CNVkit results are shown as solid lines, while PureCN results appear as dashed lines. Segments are colored red for amplifications, blue for deletions, and black for neutral regions
PON-derived signals (if PON is available). Shown as a band representing expected variation across normal samples.
Highlighted genes: Cancer-associated genes are labeled and colored.
Bottom panel (VAF)#
This panel shows:
Variant allele frequencies (VAF)
Expected reference lines: 0.5 (heterozygous); 1/3 and 2/3 (imbalance)
LOH regions are shown as shaded areas when PureCN results are available
Interpretation:
Tight clustering around 0.5 → balanced alleles
Split or shifted clusters → allelic imbalance
Flattening toward 0 or 1 → possible LOH
Gene highlighting#
Genes are highlighted in chromosome plots to emphasize biologically and clinically relevant regions. Highlighted genes are visually expanded to improve readability.
Panel analysis:
In panel-based analyses, genes are highlighted if they meet at least one of the following criteria:
Presence of CNV signal (amplification/deletion) or LOH when genes have >2 overlapping targets (probes in the panel design)
Cancer-associated genes with >2 overlapping targets
Exome analysis:
In exome analyses (--is-exome is enabled), only cancer-associated genes are highlighted, provided they have more than two overlapping targets.
Cancer associated genes#
A predefined list determines which genes are considered cancer-associated and prioritized in the report.
This list combines:
Cancer genes from OncoKB
Additional clinically relevant genes
Note
If there is a gene that you expect to see highlighted in the report but is not included, you can request its addition to the cancer gene list.
Please open an issue in the BALSAMIC repository or contact the maintainers by email.
Including a short justification (e.g. clinical relevance or panel design) helps ensure the request can be evaluated and incorporated quickly.
Gene regions#
Gene regions represent aggregated signals across bins belonging to a gene.
Creation steps#
Bins are grouped per gene
Bins are ordered by genomic position
Adjacent bins are merged into candidate runs
Runs are filtered based on signal strength
Small gaps may be bridged if signal is consistent
Final regions are collapsed into summary rows
Note
If there is no PON available, the bins of a gene are simply collapsed, and annotated with overlapping CNVkit segment information.
Each region includes:
Genomic span (start/end)
Number of targets
Mean log2 signal
PON-based interpretation#
When a Panel of Normals (PON) is provided, additional metrics are computed.
These include:
PON mean log2 per region
PON spread (expected noise)
Z-score-like signal strength
PON signal classification:
strong: strong deviation from normal (score > 5.0)borderline: mild deviation ( 5.0 < score > 2.0)noise: no significant deviation (score =< 2.0)
PON indication:
GAIN: likely amplification ((mean_log2 - mean_log2_pon) > 0.07)LOSS: likely deletion ((mean_log2 - mean_log2_pon) < -0.07)
Note
Only “strong” signals are classified as GAIN / LOSS, otherwise, gene-region is set to NEUTRAL
Only genes with a minimum of 8 targets will be considered for this PON based GAIN / LOSS indication
Important:
PON interpretation is only available if a PON file is provided
Segment table#
The segment table combines CNVkit and PureCN results.
Columns include:
Chromosome and genomic coordinates
Segment size
CNVkit log2 and copy number
PureCN copy number and LOH annotations
Cytoband
Genes in segment (see note below!)
CNV calls are standardized:
Amplification
Deletion
Neutral
Note
Only genes with a minimum of 2 targets are shown in the segment table
For exome this is further limited to only show cancer-associated genes
PureCN purity and ploidy estimation#
PureCN is used to estimate the purity and ploidy of the tumor sample, based on the evidence of CNVs and VAFs in the tumor sample.
Warning
Note that PureCN estimation may be inaccurate or fail entirely.
Treat therefore the purity and ploidy estimation in the top table with caution and not as definitive measurements.
If PureCN is unable to determine a purity/ploidy solution, no output is generated. In such cases, PureCN results will be absent from the report, and CNVkit log2-adjusted values will instead be calculated using default assumptions of 20% purity and 2 ploidy.
Sex-aware interpretation#
Copy number interpretation accounts for sex chromosomes:
X and Y are interpreted differently depending on sample sex
Prevents misclassification of normal sex chromosome states
Gene region table#
The gene-region table summarizes CNV signals at gene level.
Includes:
Gene name
Number of targets
Mean log2
CNVkit and PureCN calls
PON-based metrics (if available)
This table is useful for:
Seeing indications for focal amplifications/deletions that may be missed by Cnvkit or PureCN
Warning
The gene-region analysis is based on a custom aggregation method and has not been formally validated for clinical use.
The signals shown here should be interpreted as supportive evidence only and must not be used as standalone or definitive CNV calls.
Any findings from this table should be confirmed using established CNV callers (e.g. CNVkit, PureCN) and/or orthogonal methods before being considered for clinical interpretation.
Quality metrics#
The report includes summary QC metrics:
Log2 noise#
Derived from adjacent bin differences
Similar to CNVkit DLRSpread
Lower values indicate cleaner signal
Filtered targets#
Number of bins removed relative to PON
Indicates how much of the original panel design could be used for CNV analysis
Limitations#
CNV detection depends on coverage quality and tumor purity
Small focal events may be missed in low-coverage regions
PON interpretation depends on quality and composition of normal samples
LOH detection requires reliable PureCN results